SOME DEFINITIONS IN THE WORLD OF WIFI:
click above for Wiki page
Electronics for Art and Education
Introduction to Electronics // Electronics Explained and applied
Lessen voor ArtofSound
SOME DEFINITIONS IN THE WORLD OF WIFI:
click above for Wiki page
AUDIO SPEAKER AND ARRAY SETUP
RESOURCE MANAGER
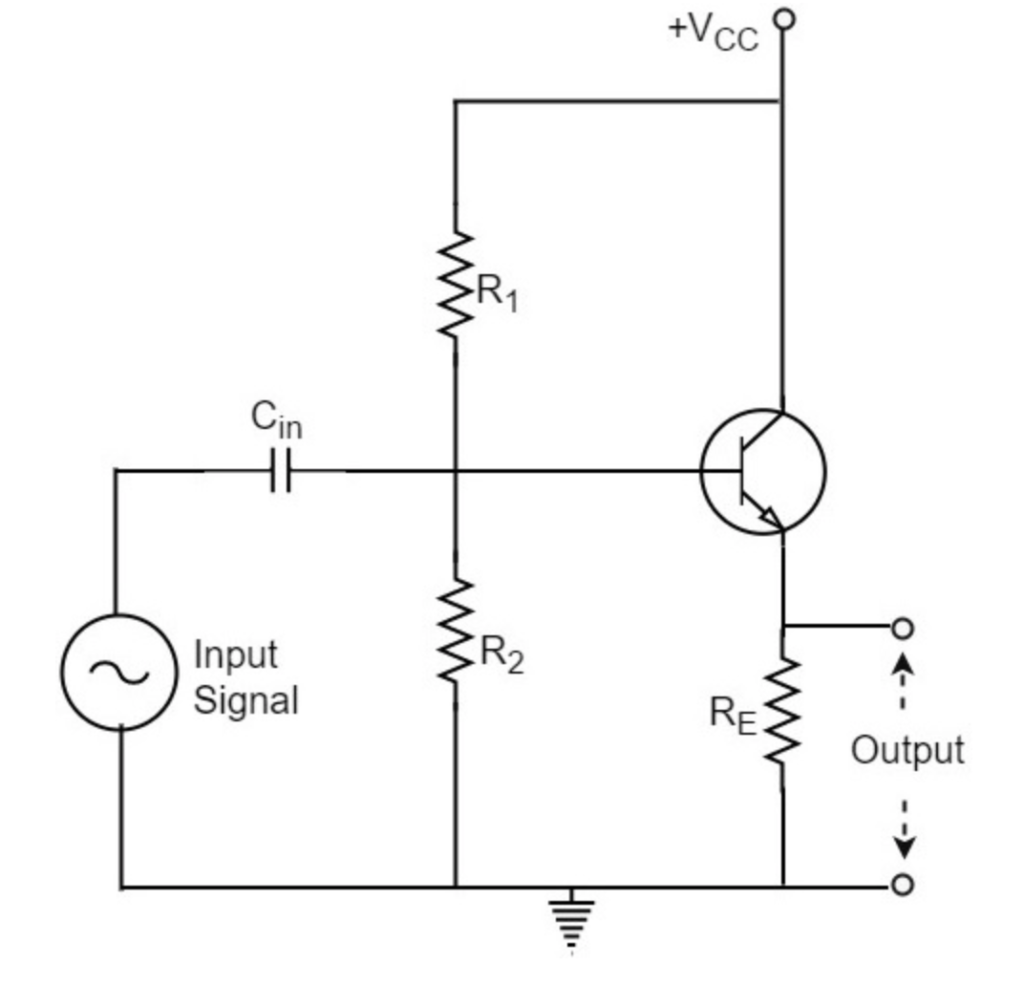
The invention of the transistor in the 1950’s changes the electronic world for ever. The transistor is a so called ‘semiconductor’ and is capable of amplifying signals. The transistor has a Collector (C), a base (B) and an emitter (E). It can be seen as a current controlled switch. A small current from the base to the emitter creates a bigger current (Ic) from the collector to the emitter. Take a look at this video-page, for a detailed explanation.
Imagine the transistoras the following setting: a large tube connected to a big pool of water. Halfway the tube there is a valve that can be changed position by a small tap on the side. Check figure 1.
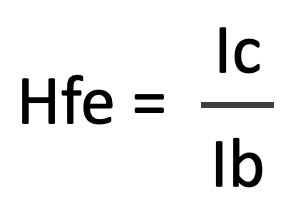
If there’s no base current (ib=0) the transistor is closed and there’s no collector-current. If the base current Ib is increasing (we turn the small tap on the side – Ib > 0), the water-flow (=current or Ic) will increase as well. Check figure 2. If the Ib is maximum, the collector current Ic is at its maximum as well. The proportion between Ib and Ic is called the Hfe. This number represents the amount of current amplification.
MORE HISTORICAL INFO:
RMS Voltage Calculator (/calculators/rms-voltage- calculator)
This RMS Voltage calculator helps to 4nd the RMS voltage value from the known values of either peak voltage, peak- to-peak voltage or average voltage. It calculates the RMS voltage based on the given equations.
RMS (Root Mean Square) Voltage (Vrms)
Every waveform’s RMS value is the DC-equivalent voltage. Let’s take an example, if the RMS value of a sine wave is 10 volts then it means you can deliver the same amount of power via DC source of 10 volts. Do not confuse in between Average voltage and RMS voltage, as they not equal.
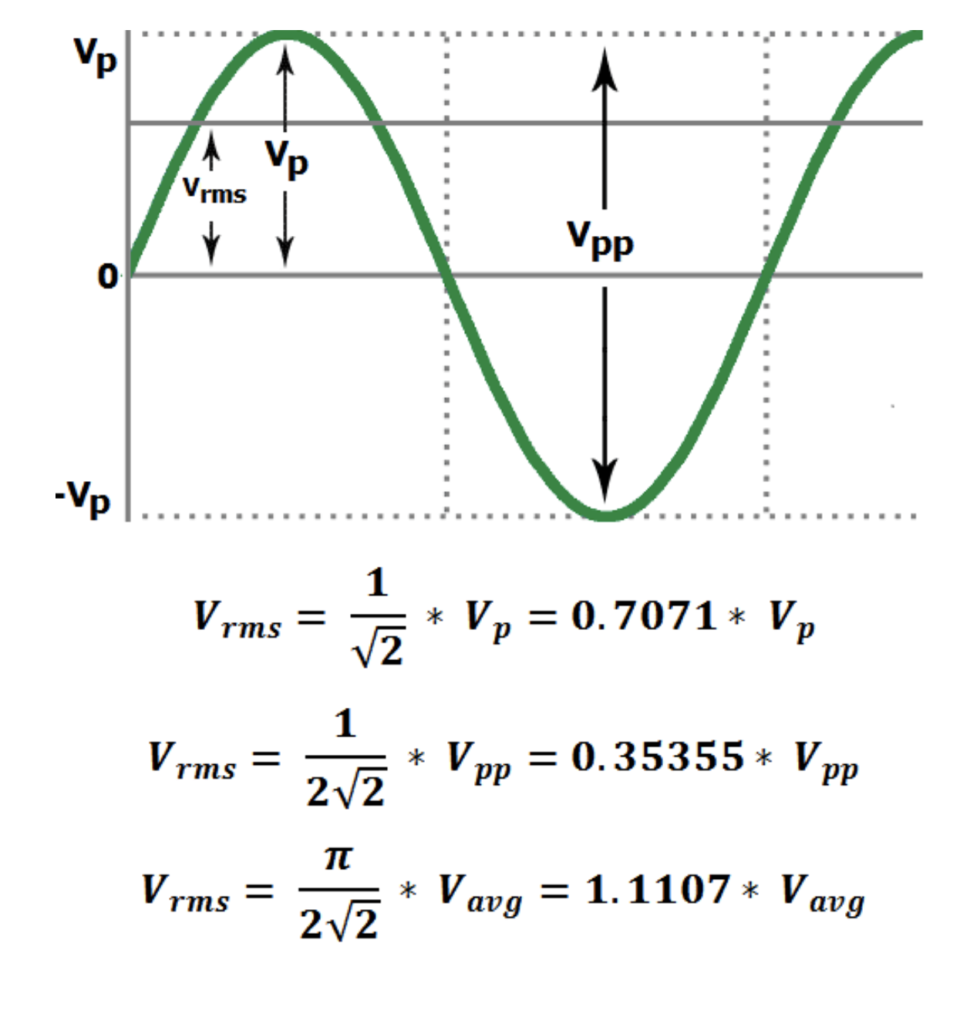
Peak Voltage (Vp)
A Peak voltage of a sine wave is measured from the horizontal axis (which is taken from the reference point 0) to the crest (which is the top or maximum voltage level) of the waveform. Peak voltage shows the amplitude of the waveform.
Vp = √2 * Vrms
By, this formula we can get the value Vrms of with respect to peak voltage.
Vrms = 0.7071 * Vp
Peak-to-Peak voltage (Vpp)
The difference between maximum peak voltage and minimum peak voltage, or the sum of the positive and negative magnitude of peaks is known as the Peak-to-Peak voltage.
Vpp = 2√2 * Vrms
By, this formula we can get the value of Vrms with respect to peak-to-peak voltage.
Vrms = 0.35355 * Vpp
Average voltage (Vavg)
The average value of a sine wave is zero because the area covered by the positive half cycle is similar to the area of the negative half cycle, so these value cancel each other when the mean is taken. Then the average value is measured by the half cycle only, generally we take the positive half cycle part for measuring.
The average voltage de4ned as “the quotient of the area under the waveform with respect to time”.
Vavg = 2√2/π * Vrms
By, this formula we can get the value of Vrms with respect to peak-to-peak voltage.

For this course we will use Vectorworks that has a free studentversion. We will learn to draw in 2D, make some stageplans with the use of the resourcemanager (library) and later we will move over to 3D.
The assignment will be: draw the new Ensemble hall of Amare in 3D, postion a stage and chairs (more t.b.a.)
Vectorworks has a great number of online tutorials and for almost any question is an online answer. One can also use the possibilities under “Help” in the VW menu.
Essential is to train the basic skills by doing this Basic Tutorial.
TUTORIAL BOOK ON VECTORWORKS SPOTLIGHT
Some PDF’s of Amare KC Halls, scale unknown.
Classroom:
Hall:
Rehearsal Hall
Ensemble Hall
TUTORIALS SMAART IR MEASUREMENTS
MAPP3D is a 3D prediction app made by MeyerSound. It’s free and gives very precise predictions, but it’s user interface is of the legendary Meyer “for nerds and not very handy to work with” level. One can import DWG’s of existing halls, create prediction surfaces on the audience ear level and see what the interaction is between the loudspeakers. Alas walls cannot be set yet (like in MappXT, the 2D version of MAPP)……..
To get to know the quirks of the program, one should follow these instruction movies by Merlijn van Veen:
MAPPXT is a free 2D prediction program from Meyersound, that give very precise predictions of the Meyer speaker range in a 2D environment. One can put in walls and absorption elements, but it has some limitations in the geometry of the spaces one can build. Still one can use MAPPXT to check out interaction between loudspeakers and (sub) arrays. There is a direct connection to the Galaxy and Galileo processors from Meyersound that can be inserted in the setup and also transefered to these processors.
Still it tkaes some time to get used to the limited and old fashioned user interface. For that reason it’s important to follow some tutorials.
TUTORIALS ON SMAART 8